What k in pass@k tries to buy you
Repeating a question gives a model more chances to answer correctly. The k-pass, usually written pass@k, measures the chance of getting at least one correct answer in k attempts. Under the usual model of independent attempts, this probability increases with k even though the model itself has not improved. The useful questions are how much it increases and what that increase tells us about performance in practice.
This note uses per-question hit rates from Bernoulli to examine the effect of extra attempts on two evaluation suites: general365 and TruthfulQA. A hit rate is the fraction of attempts that answered a given question correctly. We use a Beta distribution to describe how these rates vary across questions. The model is Nemotron Lightning 3.5-30B-A3B, sampled at temperature 1, with separate runs for the think and nothink modes.
Low success rates on general365
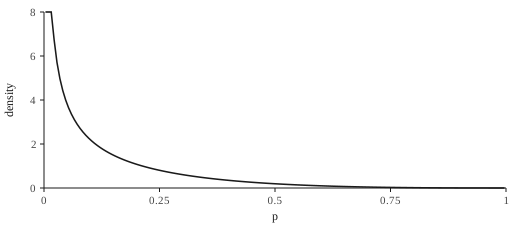
On general365, many per-question hit rates are close to \(p=0\), and the overall success rate on a single attempt is about 0.10. A right-skewed Beta(0.40, 3.5) gives a useful approximation: its mean is 0.103, compared with the observed mean of 0.104. These parameters were chosen by visual inspection rather than statistical fitting. The approximation is enough to illustrate how pass@k changes the distribution.
What repeated attempts change
For a question with success probability \(p\) on each independent attempt, the probability of at least one success is
This is the same calculation used for parallel redundant systems: the system succeeds if at least one component succeeds. Independent attempts can therefore reduce the chance of complete failure. The calculation assumes that each attempt has the same success probability \(p\) and that one outcome does not affect another.
For an LLM, repeated sampling gives the same model more opportunities to produce a correct answer. It does not remove weaknesses in its knowledge or reasoning. A question that the model usually answers incorrectly may remain difficult across many attempts. Sharing weights and a prompt does not, by itself, make independently sampled outputs statistically dependent. It does mean that extra samples draw on the same model capabilities rather than providing independent sources of knowledge.
The calculations below assume independent sampling at a fixed success probability for each question. We have not tested that assumption here. If the sampling procedure produces dependent attempts, equation (1) may misstate the benefit of repetition. It is not a general upper bound for every form of dependence.
There is also a practical limit: getting at least one correct answer is useful only if you can identify it. A coding benchmark can use its tests to decide whether any sample passes. A user choosing among several plausible answers may have no equally reliable check. Pass@k measures the availability of a correct answer among the attempts, not the probability that the user will select it.
When \(p\) is small and k is modest, equation (1) is approximately \(kp\). A question with a success probability of 0.01 reaches only about 0.03 at \(k=3\). Repetition raises its chance of success, but that chance remains low. Questions with a success probability of exactly zero receive no benefit.
The increase is more noticeable for questions with moderate success probabilities. At \(k=2\),
A question answered correctly half the time therefore has a pass@2 of 0.75. That is the same numerical score as a question answered correctly 75% of the time on one attempt, but it describes a different level of performance. Comparing scores without keeping the number of attempts visible hides that distinction.
If the underlying success probabilities across questions follow a Beta(\(\alpha,\beta\)) distribution, the average pass@k has a closed form. Using \(E[(1-P)^{k}]=B(\alpha,\beta+k)/B(\alpha,\beta)\), where B is the beta function, we get
At \(k=1\), this reduces to the Beta mean, \(\alpha/(\alpha+\beta)\). The closed form lets us calculate the average without simulation. For the general365 approximation, the predicted mean rises from 0.103 at \(k=1\) to 0.176 at \(k=2\), 0.232 at \(k=3\), and 0.313 at \(k=5\). The average improves, although many questions still have low success probabilities.
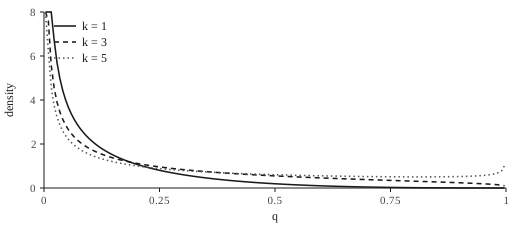
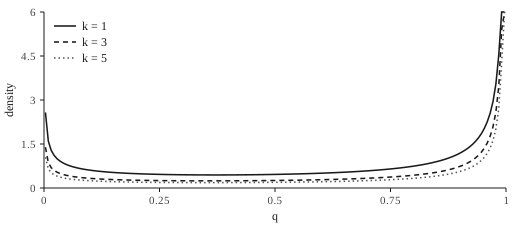
A change of variables gives the density of the transformed probability \(q=1-(1-p)^{k}\):
This density integrates to 1, and its mean agrees with equation (2). As k increases, the distribution shifts toward higher probabilities, while substantial density remains near zero. Looking at the whole distribution shows which questions benefit from repetition and which remain difficult.
Variation in the 720-question average
Benchmark scores usually average results over questions. That average varies with the questions included. A Monte Carlo simulation with 2,000 samples of 720 probabilities drawn from Beta(0.40, 3.5) gives an average near 0.103 before the transform and 0.232 at \(k=3\), consistent with the closed form. For this distribution, the transform also increases the variation in the sample mean. For the more central TruthfulQA fits below, it reduces that variation. Changing k therefore changes both the average score and its sampling distribution.
Thinking versus repeated attempts
The TruthfulQA runs use the same model on 817 questions in each mode. In nothink mode, per-question hit rates are broadly distributed. In think mode, more of them are close to \(p=1\). A maximum-likelihood estimate (MLE) gives Beta(1.506, 1.142) for nothink, with a fitted mean of 0.569 against an observed mean of 0.573. For think, the fitted Beta(0.561, 0.255) has a mean of 0.687, well below the observed 0.757. The concentration of observed rates at 1 is poorly represented by this continuous Beta fit, so it is less useful for predicting the think-mode average.
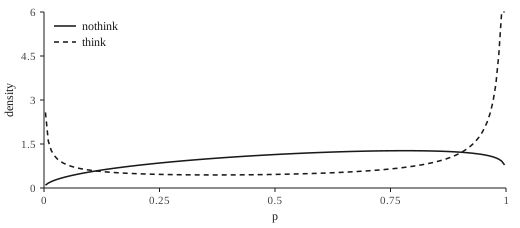
Table 1 uses equation (2) for the general365 approximation and the TruthfulQA nothink fit. For TruthfulQA think, it instead averages \((1-(1-p)^{k})\) over the observed per-question hit rates. This avoids the poor Beta fit and preserves the observed mean at k = 1. Both approaches still assume independent attempts.
| k | general365 | TQ nothink | TQ think |
|---|---|---|---|
| 1 | 0.103 | 0.569 | 0.757 |
| 2 | 0.176 | 0.747 | 0.836 |
| 3 | 0.232 | 0.829 | 0.865 |
| 4 | 0.276 | 0.874 | 0.882 |
| 5 | 0.313 | 0.903 | 0.893 |
On TruthfulQA, the predicted nothink score with two attempts is 0.747, close to the observed think score of 0.757 with one attempt. Similar scores can therefore describe quite different combinations of model mode and sampling budget. On general365, the same increase from one attempt to two raises the predicted mean only from 0.103 to 0.176.
The change in the average also depends on the shape of the distribution. The nothink mean rises from about 0.57 at \(k=1\) to 0.75 at \(k=2\) and 0.83 at \(k=3\). The think mean starts near 0.76 and reaches about 0.84 and 0.87 at the same values of k. It has less room to improve because many questions already have high hit rates. Figures 5 and 6 illustrate this difference using the fitted distributions.
By k = 3, think still leads: 0.865 versus 0.829 for nothink. At k = 5, their averages are within about one percentage point, with nothink slightly ahead in Table 1. The similar final scores do not erase the difference on a single attempt, and these calculations do not compare the modes at equal compute cost. A comparison needs to state both the model mode and the number of attempts.
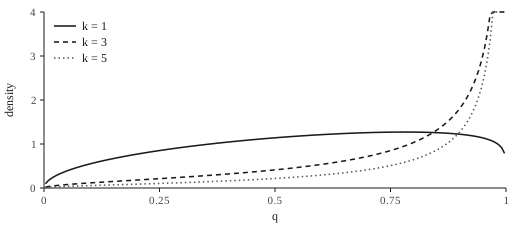
The Monte Carlo calculation for an 817-question average shows the same pattern: the k = 3 transform raises the nothink mean more than the think mean. This is expected when the think distribution already places more probability near 1.
How to read pass@k
Pass@k is useful when the task allows several attempts and provides a reliable way to check the answers. It tells us how often that process can produce at least one success. Its interpretation depends on the sampling procedure, the checking method, and the number of attempts. A higher pass@k alone does not establish better performance on a single attempt, and similar averages can conceal different distributions of per-question success rates.
The Beta distribution is a simple approximation to the variation in success rates across questions. It helps explain how repetition changes an aggregate score, but the fit can miss important features, as it does for the think-mode results here. Reporting the distribution alongside the average makes those limitations visible. The questions that remain difficult after repeated attempts deserve attention too.
Earlier notes on this: pass@k as an ephemeral chance, qualitative distortion.