Is Jev confident?
Jev is TypeSafe's System One model: instead of text tokens it returns typed answers and probabilities. Choice and Score answers also carry a confidence number, but for both primitives it is interpreted very differently. More importantly, as we figured out, confidence number does not come out of any model confidence measure per se, but it is derived from the model response only. Across one million tests, Choice confidence closely follows a normalized top probability within just a rounding error. For Score, a normalized distance from the modal level fits the observations. The practical truth, however, is that neither result establishes that Jev's confidence value relates to the probability of being right, that is model uncertainty in general.
Choice confidence is a rescaled top probability
Start with this five-option Choice example:
Top probability is 0.76, five options (N=5), confidence 0.70:
The calculation in example case would be: \((5 \times 0.76 - 1)/(5 - 1) = 0.70\). The choice responses closely follow (1): over 738,164 live choice answers the mean absolute residual, the average distance between the reported confidence and what (1) predicts, is 0.005, which is half of the last digit the API prints, and the largest single miss in the whole sample is 0.023. For two options, the residual never exceeds 0.010 across 76,807 answers. Generally these small discrepancies are consistent with the limited precision of the returned values and perhaps some effects of parallel processing. They do not by themselves prove the implementation on Typesafe side, but the observed effect is well defined for any practical purpose. Effectively, the confidence value returned by Jev API says how far the top choice probability is from pure chance for that option set. It is a rescaling of a quantity the model already returned, not a statement about how confident the model is about the answer in general: no other physical meaning follows from the number. Relied upon blindly, it can lead to significant inconsistencies in practical downstream implementations.
For the simplest example, padding a list with options that receive no probability at all is enough to lift the confidence:
| \(p_{\mathrm{max}}\) | N = 2 | N = 3 | N = 5 | N = 10 | N = 20 |
|---|---|---|---|---|---|
| 0.50 | 0.000 | 0.250 | 0.375 | 0.444 | 0.474 |
| 0.60 | 0.200 | 0.400 | 0.500 | 0.556 | 0.579 |
| 0.74 | 0.480 | 0.610 | 0.675 | 0.711 | 0.726 |
| 0.90 | 0.800 | 0.850 | 0.875 | 0.889 | 0.895 |
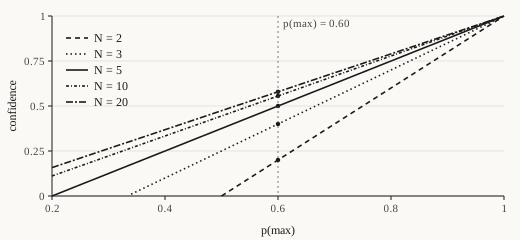
At fixed option count and top probability, materially different distributions receive the same predicted confidence; changing the option count changes that confidence even if the top probability stays fixed.
And, obviously, if you care about anything else except the top choice, the returned confidence has no meaning at all, or, let's say, the meaning vanishes outside of definite single possibility answers.
Typesafe's own documentation on confidence states, incorrectly, that:[10]
The shape of that distribution is what tells you how certain the model is: concentrated on one outcome means a confident answer, spread out means an uncertain one. The answer's confidence property collapses that shape into a single number from 0 to 1, so you can threshold on it without doing the math yourself.
docs.typesafe.ai/confidence, archived 18 September 2026
As we can see, the shape of the distribution is exactly what the normalization returned by the current Typesafe API omits for Choice type of requests. At the time of the publication the explicit formula was not published either.
Normalizing for the whole list entropy is not a rescue
Naturally, taking just the top probability is the wrong summary of the distribution. Consider two answers from the sample, five options each:
Same option count, same top probability, but materially different distributions. Confidence returns (almost) the same number, 0.41 against 0.42. Instead we can propose a measure that reads the whole distribution, by normalizing the entropy against a uniform distribution over the same options, instead of just the number of options:
where H is Shannon entropy
With entropy \(H = 0.691\) for the first answer and \(H = 0.981\) for the second, (2) gives \(1-0.691/\log 5 = 0.570\) against \(1-0.981/\log 5 = 0.391\), a fifth of the whole way from 0 to 1 apart where Jev's confidence differed just by 0.01.
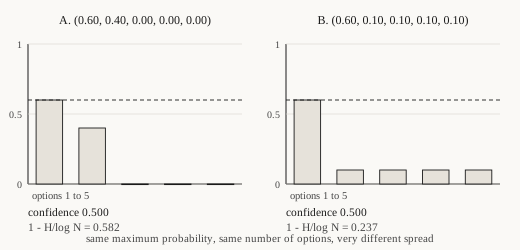
But a spread measure is not the model's confidence either. The returned choice distribution is the model's internal vote across the labels you supplied, and the shape of that vote is a fact about the label set and the state. A uniform answer (or the part of) can be flat because the model chose wrong (comparing to reality) path, because it simply has no information, or because several labels overlap. A peaked answer can be peaked and still wrong. Any given single answer can be untypical for the expected model response in general. Normalizing for the entropy of all the the returned choices gives a better description of the returned distribution, but no information about the confidence level in the choice process itself.
Score uses a modal concentration measure based on mean absolute deviation
Score API uses an ordered rubric rather than an unordered choice list, and its returned confidence is a different kind of quantity. The rule it follows is a modal concentration measure based on mean absolute deviation. Let \(p_i\) be the probability of level \(i\), levels numbered \(0,\ldots,L-1\), and \(m\) a most probable level:
This looks complicated.
The numerator is the mean absolute deviation about the mode, the average number of levels by which a draw from the distribution misses the most probable level. The denominator is what that quantity equals for a uniform distribution measured from a central level, so the measure reads 0 when the rubric is maximally spread and 1 when all mass sits on one level. Because the deviation is taken from the mode rather than the mean or median, mass near the winning level counts differently from mass far away even when the top probability is unchanged. The result is clipped at 0 because a distribution can be more spread than uniform when it is bimodal at the ends. Keep the probabilities in rubric order when calculating it, since sorting them destroys that information. For two levels the expression reduces to \(2p_{\mathrm{max}}-1\), the same as Choice with two options. The numerator is also happens to be 1-Wasserstein distance from the returned distribution to a point mass at the modal level, when adjacent rubric levels are one unit apart. It is the average distance the probability mass must be moved to reach that level. The fraction inside the subtraction is this distance divided by the uniform-reference denominator, not the Wasserstein distance itself.[9]
This parameter-free formula has a mean absolute residual of about 0.008 across all 166,880 Score answers tested. The remaining discrepancies are small enough to require just an accounting for the API's two-decimal output.
We'll not go too far in the discussion of the choice of the formula, or whether it is encoded somewhere in the service explicitly or we just derived the generalized result: this would require far more elaborate research. For example, the mean absolute distance is minimized by a median, not necessarily the mode. Jev returns an expected score, yet this statistic measures distance from the mode, not from that reported score expectation.
However, the important distinction between Jev's Score confidence quantity and model uncertainty is simpler: this is a measure of concentration around an ordered level, not evidence that the model is cetain about the returned level and the spread itself.
The Typesafe's documentation is lacking the explicit formula for confidence returned by scores requests as well.
docs.typesafe.ai/confidence, archived 18 September 2026
Where this sits in the literature
Measures of this shape have a home in the literature on ordinal data, where they are called ordinal dispersion or ordinal consensus measures, and they are used as uncertainty measures for ordinal classification. Leik proposed a dispersion statistic built on the cumulative distribution,[2] Blair and Lacy extended that family and its squared variant,[3] and Van der Eijk built an agreement measure on ordered rating scales that, like Leik's, does not assume equal spacing between categories.[5] Tastle and Wierman take the same instinct in a different direction, normalizing distance from the mean inside a logarithm and calling the complement dissention.[4] Haas and Hüllermeier survey these measures and turn them into uncertainty scores for probabilistic ordinal classification, on the argument that entropy, margin and top probability are the wrong summaries when labels are ordered.[1] Schulz and colleagues apply the Leik-style consensus score to quantify uncertainty in surrogate explanations of classifier decisions.[6] On the classification side, ordinal methods treat the label scale as ordered and commonly require the returned distribution to be unimodal, a property these concentration measures speak to directly, and dispersion and consensus statistics are standard tools in that literature.[7][8]
What Jev appears to compute is a member of that family, though not any of the named ones exactly. The published measures work from cumulative probabilities or from the mean. This one works from the mode, uses a linear absolute deviation rather than a logarithmic or squared penalty, and normalizes against the uniform distribution. That is why calling it a modal concentration measure based on mean absolute deviation is the accurate description, and why a reader who looks for the formula under an established name will not find one.
(Note: the current literature summary was a quick research task delegated to several agents. If you know any important references which are omitted please contact the author)
What a real confidence would look like
First of all, a number that describes the summary of the returned single result distribution (even in its crippled form (1)) describes the model’s stated uncertainty, not the reliability of its answer. Interpreting that summary as confidence in correctness requires evidence beyond the model response itself, such as validation against observed outcomes. In turn, assessing uncertainty about the probability estimates themselves requires an additional layer of uncertainty.
A useful additional measurement is a meta probability: the distribution of probabilities the model returns on repeated or sufficiently similar inputs. It describes stability across calls and payload classes, rather than concentration within one answer. E.g. Taleb and Cirillo formalize nested doubt of this kind as a regress of uncertainty, and in the part of their paper on machine learning and AI safety they argue that a printed confidence is only an estimate of an estimate: a safe model should report a meta-assessment of its own certainty, not a brittle point such as 0.995.[11] We can also track the distribution of normalized entropy (2) across multiple experiments with same or perturbed payloads as a summary of how the whole option set behaves. But even stable answers can still be wrong. To measure calibration, we need labeled outcomes: among answers assigned a given confidence, how often is the decision actually correct? Both stability and calibration matter for a production threshold, and neither follows from the returned distribution alone.
That is what we hoped the confidence field was, and it is why the measurement in its current returned form is a disappointment. A model that reported genuine certainty, calibrated during training rather than rescaled at the API boundary, would be a real step forward for anyone building decision systems on top of it. What the measurements support is a summary of the returned distribution: its leading probability for Choice, and its concentration around the modal level for Score. The full distribution is still available. Calling either summary confidence does not establish model uncertainty or calibration. However it is worth knowing which type of measurement of the two you are holding at hands, since community already reports the use the confidence value for decision making.
An even more important point is that, in principle, the measurement of confidence should be moved from the level of model output to the level of outcomes produced by the system that uses the model. After all, how often and how badly Jev can be wrong depends, at the very minimum, on how often the model adopter encounters such errors in their own data and how far the consequences of those errors propagate. Here, communication between the model provider and the client should be fully transparent, without implying that the system delivers results beyond what is explicitly stated. With the probabilistic claims Typesafe makes in its documentation, the discussion enters a new level of required rigor. At the very minimum, no formula used at the response level should be omitted from the documentation when that same documentation provides explicit or implicit guidance on how to interpret it. For example, formula (1) may be questionable, but it is at least fairly obvious from the shape of the returned data. Formula (3), however, raises too many questions for it to be addressed in a basic article.
Instead of the P.S.
The same call twice does not return the same answer
Jev is apparently sampled, or not precise enough in calculations (like almost any other model on the market), so a byte-identical payload lands on different numbers from run to run, and the effect grows as the answer becomes less definite. Ten identical calls on one ambiguous ticket kept the same winning label and moved confidence from 0.84 to 0.88. A case with a definite answer returned byte-identical results six times out of six. On a flat question the label itself moved:
| Case | Calls | Confidence | Labels |
|---|---|---|---|
| ambiguous ticket, 3 options | 10 | 0.84 to 0.88 | one label, 10 of 10 |
| definite answer, 4 options | 6 | 1.00 | one label, 6 of 6 |
| flat question, 4 options | 9 | 0.12 to 0.19 | replacement 7, exchange 2 |
A further eight calls on the almost uniformly crafted question about support tickets returned replacement six times, exchange once, and refund once. When the leading options sit within about 0.05 of each other, the label is not stable even on the small number of requests, and a single call near a threshold is a coin toss wearing a decimal. None of this is surprising, and it is not a flaw for itself. It does mean that the real confidence, whatever that may be for your model application, again, cannot be read as a fixed property of a payload, since the confidence especially near the tie should be treated as a probability of a decision rather than as a decision.
References
- S. Haas, E. Hüllermeier. Uncertainty quantification in ordinal classification: a comparison of measures. International Journal of Approximate Reasoning 186 (2025) 109479. doi
- R. K. Leik. A measure of ordinal consensus. Pacific Sociological Review 9(2) (1966) 85-90. doi
- J. Blair, M. G. Lacy. Statistics of ordinal variation. Sociological Methods and Research 28(3) (2000) 251-280.
- W. J. Tastle, M. J. Wierman. Consensus and dissention: a measure of ordinal dispersion. International Journal of Approximate Reasoning 45(3) (2007) 531-545.
- C. van der Eijk. Measuring agreement in ordered rating scales. Quality and Quantity 35 (2001) 325-341.
- J. Schulz, R. Poyiadzi, R. Santos-Rodriguez. Uncertainty quantification of surrogate explanations: an ordinal consensus approach. arXiv:2111.09121 (2021). arXiv
- P. A. Gutiérrez, M. Pérez-Ortiz, J. Sánchez-Monedero, F. Fernández-Navarro, C. Hervás-Martínez. Ordinal regression methods: survey and experimental study. IEEE Transactions on Knowledge and Data Engineering 28(1) (2016) 127-146. doi
- C. Beckham, C. Pal. Unimodal probability distributions for deep ordinal classification. International Conference on Machine Learning, PMLR (2017).
- C. Villani. Optimal Transport: Old and New. Grundlehren der mathematischen Wissenschaften 338, Springer (2009).
- TypeSafe AI. Confidence. docs.typesafe.ai/confidence, archived 18 September 2026, web.archive.org.
- N. N. Taleb, P. Cirillo. The regress of uncertainty and the forecasting paradox. Risks 13(12) (2025) 247. doi